|
Getting your Trinity Audio player ready...
|
A cyber attack graph is a representation of all possible paths of attack against a cybersecurity network, illustrating a state where an attacker has completed a successful breach. There are two popular forms of attack graphs. The first is a direct graph where nodes represent network states and edges represent exploits that transform one state into a more compromised state, ultimately showing a successful attack. A second form is a direct graph where nodes represent pre or post-conditions of an exploit, and edges represent the consequences of having a pre-condition that enables an exploit post-condition.
The Use of Attack Graphs
Cybersecurity defenses must be continuously tested to ensure optimal asset protection. Scanning a network and identifying vulnerabilities, however, does not go far enough. Today’s networks feature multiple platforms and diverse software products, resulting in multiple layers of connectivity. The complexity of such environments poses a serious challenge to even the most conscientious security teams.
For deeper insight into overall risk, it is important to understand how vulnerabilities interact with hosts and with each other. By understanding this level of complexity and gaining visibility into how exposures are likely to be exploited — using the perspective of adversaries and charting their likely attack paths — organizations develop fuller insight into their true state of risk.
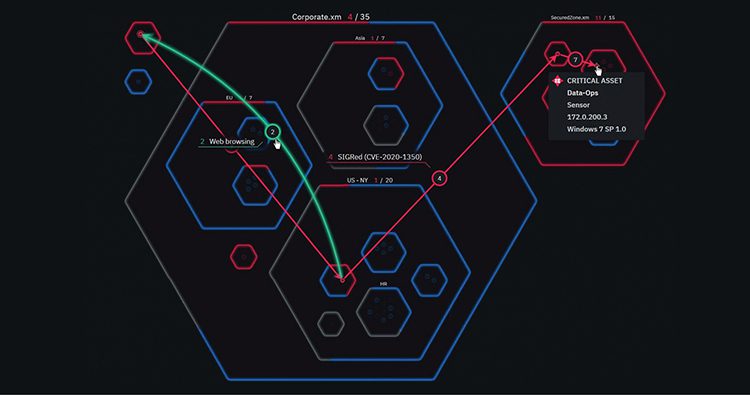
The use of a cyber attack graph is a key part of this process. Cyber security graphs can be used to construct multi-stage attack paths where each path represents a chain of exploits that could be leveraged by an attacker to penetrate a network. Attack graph techniques, therefore, are critical to understanding not only where vulnerabilities exist, but how they are most likely to be exploited, and what that means for an organization in terms of protecting high-value assets.
How Enterprises Use Attack Graphs to Protect Critical Assets
Red teams — also commonly referred to as “ethical hackers” — assume the role of adversaries, then proceed to test an organization’s cybersecurity defenses by developing and launching attacks against uncovered vulnerabilities. Historically, red teams have drawn massive attack graphs by hand to identify vulnerabilities in networked systems.
However, this manual graphing process requires enormous effort when dealing with larger systems and is exceptionally tedious. Like many manual cybersecurity processes, it is also highly dependent on the variable skill of those undertaking the process and thus prone to error.
Automated attack graphing has become much more widely adopted in recent years, as organizations increasingly deploy cybersecurity solutions with this capacity for detection, defense and forensic purposes. One such example includes automated exposure prioritization platforms that use sophisticated attack modeling to identify not only where vulnerabilities exist, but how they can be exploited.
By charting possible attack paths, it becomes possible to identify vulnerabilities and prioritize their remediation according to key risk context. The process helps organizations focus on the small number of exposures that present the gravest possible risk, rather than wasting resources patching issues that pose risk at all.
Ultimately, as cyber attack graphs continue to be refined and improved, they will play an even greater role in the protection of “crown jewel” assets from determined adversaries.